Optical Image
Optical Image
Description
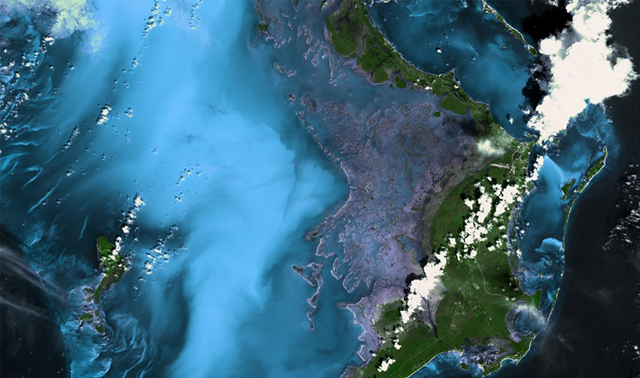
The picture at the top, which was used for the competition, is an optical image taken by a Multi-Spectral Imager (MSI) carried aboard ESA’s Sentinel-2A satellite. Optical data includes the visible wavebands and therefore can produce images, like this one, which is similar to how the human eye sees the world.
The green square in the centre of the image is the moat surrounding the temple complex; on the east side is Ta Kou Entrance, and the west side is the sandstone causeway which leads to the Angkor Wat gateway. The temples can be clearly seen in the centre of the moat, together with some of the paths through the forest within the complex.
To the south-east are the outskirts of Siem Reap, and the square moat of Angkor Thom can be seen just above the site. To the right are large forested areas and to the left are a variety of fields.
In addition to the three visible bands at 10 m resolution, Sentinel-2A also has:
• A near-infrared band at 10 m resolution,
• Six shortwave-infrared bands at 20 m resolution, and
• Three atmospheric correction bands at 60 m resolution.
The very-high-resolution constellation
Pléiades 1A and Pléiades 1B operate as a constellation in the same orbit, phased 180° apart.The identical twin satellites deliver very-high-resolution optical data products in record time and offer a daily revisit capability to any point on the globe.
Quick Delivery
The Pléiades constellation is designed to obtain data in double-quick time:
• Ability to acquire imagery anywhere in the world in less than 24 hrs. in response to a crisis or natural disaster.
• Regular monitoring, as often as every day if required.
• Three satellite work plans a day ensure easy handling of last-minute tasking requests.
• Twice the coverage and twice the chance of obtaining cloud-free imagery.
for more technical information please visit : Pléiades
If you need more information, please download the brochure here
Spot the Difference
With SPOT 6 and SPOT 7, the SPOT series is entering a new era. Together, the two satellites form an Earth-observation constellation with highly responsive sensors that increase acquisition capacity and simplify data access.
While retaining SPOT’s trademark 60-km wide imaging swath, SPOT 6 and SPOT 7 offer users a number of key improvements:
• 1.5-metre-resolution natural-colour products, orthorectified as standard
• Multi-year coverage of entire national territories
• Daily revisits to any point on the globe
• Ability to accommodate last-minute tasking requests
• Billing per area of interest
Built with a 10-year lifetime warranty, SPOT 6 and SPOT 7 assure continuity of high-resolution data services through to 2024.
The Big Picture
SPOT 6 and SPOT 7 are designed to cover wide areas in record time, making it possible to regularly update national map series free from the constraints imposed by seasonal conditions.
• The constellation covers up to 6 million sq.km. every day, an area larger than the entire European Union.
• Four weather forecasts per day are integrated automatically into the tasking process to optimize efficiency. As a result, 60% of images have less than 10% cloud cover.
for more technical information please visit : Spot 6/7
If you need more information, please download the brochure here
SPOT 1 to SPOT 5
The SPOT satellites have been supplying high-resolution, wide-area optical imagery since 1986. The 26-year archive acquired by SPOT 1 through to SPOT 5 contains more than 30 million images at resolutions of 20 to 2.5 metres, all accessible from Geostore.
Simplified product range
• SPOT Scene, the standard SPOT satellite image (3,600 sq.km)
• SPOTView orthorectified images
• SPOTMaps nationwide natural-colour mosaics
• DIMAP, the industry-standard format for digital mapping products since 2002
• Precision orthoimages generated with the Elevation30 DEM reference database
for more technical information please visit : Spot 5
If you need more information, please download the brochure here
Superior Image Quality, Tackling Challenging Acquisitions
The Earth observation satellite KazEOSat-1 recently expanded Airbus Defence and Space’s broad constellation services.
KazEOSat-1, launched in April 2014, is a very high-resolution (1 metre) satellite that provides high quality mono and stereo monitoring over challenging Areas of Interest for applications in the fields of monitoring natural and agricultural resources, mapping, as well as defence and security applications.
KazEOSat-1 was manufactured by Airbus Defence and Space, and is operated by Kazakhstan Gharysh Sapary (KGS).
for more technical information please visit : KazEOSat-1
If you need more information, please download the brochure here
A Cost-Effective Solution for Rapid Coverage and Frequent Revisit of Large Areas
Airbus Defence and Space adds DMC Constellation products to the overall satellite imagery portfolio. The DMC Constellation provides multispectral 22 m imagery with adjustable image size and option for very large images (i.e. 620 x 1,300 km). Access to the DMC Constellation images opens new perspectives to our users for the development of applications and services in various markets such as wide-area change detection, disaster monitoring, land cover mapping, environmental monitoring, forestry and agriculture.
Advantages
• Rapid coverage of large areas
• Very frequent revisit worldwide (1-2 days for mid-latitude locations)
• Adjustable image size with option for wide swath and very large images (i.e. 620 x 1,300 km)
• Large daily collection capacity (>10,000,000 Km2/day)
• Cross-calibrated satellites
• Seamless compatibility with Landsat ETM+
• Near-real-time capacity
• Competitive pricing
for more technical information please visit : DMC Constellation
If you need more information, please download the brochure here
Synoptic Picture and Local Detail
SPOTMaps provide nationwide or regional coverage, orthorectified and radiometrically harmonized, derived from colour imagery acquired by SPOT 5, 6/7. Framed according to your area, SPOTMaps are the ideal geographic reference for your visualization, mapping and planning needs.
SPOTMaps now comprise two products, at resolutions of 2.5 (SPOT 5) and 1.5 metres (SPOT 6/7):
• SPOTMaps 2.5, available over more than 110 countries, representing a total of more than 95 million km².
• SPOTMaps 1.5 which is now taking over to provide users with higher resolution.
SPOTMaps advantages
• True colour basemap offering high geometric accuracy
• Complements all types of georeferenced databases
• Integrates directly in your GIS
• Multiuser licence if required
• SPOTMaps 2.5 :
Immediately available
Suitable for working at scales up to 1:50,000
• SPOTMaps 1.5 :
Currently being acquired and produced off-the-shelf
Suitable for working at scales up to 1:25,000
for more technical information please visit : SPOTMaps
If you need more information, please download the brochure here
Radar Image
Radar Image
Description
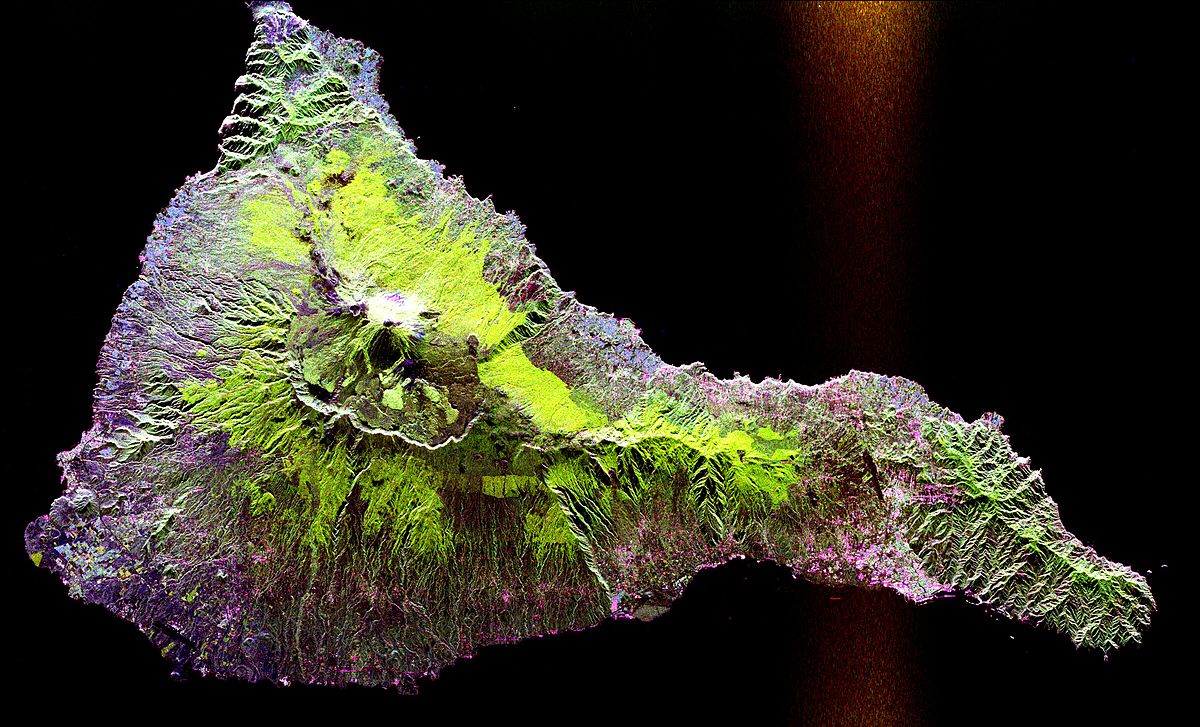
Imaging radar is an application of radar which is used to create two-dimensional images, typically of landscapes. Imaging radar provides its light to illuminate an area on the ground and take a picture at radio wavelengths. It uses an antenna and digital computer storage to record its images. In a radar image, one can see only the energy that was reflected back towards the radar antenna. The radar moves along a flight path and the area illuminated by the radar, or footprint, is moved along the surface in a swath, building the image as it does so.
Digital radar images are composed of many dots. Each pixel in the radar image represents the radar backscatter for that area on the ground: brighter areas represent high backscatter, darker areas represents low backscatter.
The traditional application of radar is to display the position and motion of typically highly reflective objects (such as aircraft or ships) by sending out an radiowave signal, and then detecting the direction and delay of the reflected signal. Imaging radar on the other hand attempts to form an image of one object (e.g. a landscape) by furthermore registering the intensity of the reflected signal to determine the amount of scattering (cf. Light scattering). The registered electromagnetic scattering is then mapped onto a two-dimensional plane, with points with a higher reflectivity getting assigned usually a brighter color, thus creating an image.
Several techniques have evolved to do this. Generally they take advantage of the Doppler effect caused by the rotation or other motion of the object and by the changing view of the object brought about by the relative motion between the object and the back-scatter that is perceived by the radar of the object (typically, a plane) flying over the earth. Through recent improvements of the techniques, radar imaging is getting more accurate. Imaging radar has been used to map the Earth, other planets, asteroids, other celestial objects and to categorize targets for military systems.
An imaging radar is a kind of radar equipment which can be used for imaging. A typical radar technology includes emitting radio waves, receiving their reflection, and using this information to generate data. For an imaging radar, the returning waves are used to create an image. When the radio waves reflect off objects, this will make some changes in the radio waves and can provide data about the objects, including how far the waves traveled and what kind of objects they encountered. Using the acquired data, a computer can create a 3-D or 2-D image of the target.
Imaging radar has several advantages. It can operate in the presence of obstacles that obscure the target, and can penetrate ground (sand), water, or walls.
Focus on the Essentials - Weather-Independent and in Near-Real-Time
TerraSAR-X and TanDEM-X dependably acquire high-resolution and wide-area radar images independent of the weather conditions. The two satellites feature a unique geometric accuracy that is unmatched by any other spaceborne sensor. With the upcoming addition of PAZ, the three almost identical satellites will be operated in a constellation and will deliver optimized revisit time, increased coverage and improved service.
Serving a Broad Range of Markets
TerraSAR-X is specifically optimised to meet the requirements of users around the globe, who require readily available, high-quality and precise Earth observation data.
for more technical information please visit : TerraSAR-X
If you need more information, please download the brochure here
In order to cover a geographical area larger than one scene, neighbouring geocoded or orthorectified images are combined into one image in a seamless way. Such a mosaic is quickly interpretable and combinable with other sources of information and can be used for map sheet generation.
A Radar Mosaic MCSAR is a seamless assembly of adjacent images into a single, harmonised dataset. The intersection lines are specifically selected in order to avoid the visibility of cutting edges. The radiometric adjustment of all scenes results in a homogeneous image mosaic.
The MCSAR product characteristics are:
• Multilook detected geocoded / orthorectified product
• WGS 84 with standard projections UTM or UPS
• Source map depicting the relevant input image for each pixel
Subsets of mosaics can be represented as Oriented Image OISAR. These subsets are characterised by a map sheet index corresponding to relevant national mapping standards or customer-defined grid systems.
for more technical information please visit : TerraSAR-X Radar Mosaics
Elevation Data
Elevation Data
Description
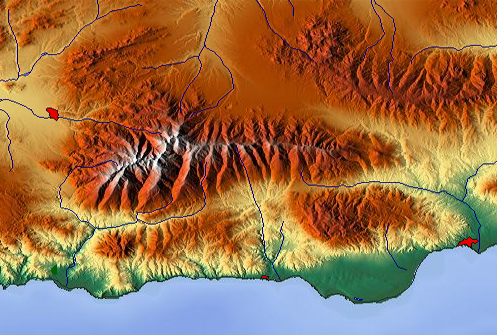
A digital elevation model (DEM) is a digital model or 3D representation of a terrain's surface — commonly for a planet (including Earth), moon, or asteroid — created from terrain elevation data.
There is no universal usage of the terms digital elevation model (DEM), digital terrain model (DTM) and digital surface model (DSM) in scientific literature. In most cases the term digital surface model represents the earth's surface and includes all objects on it. In contrast to a DSM, the digital terrain model (DTM) represents the bare ground surface without any objects like plants and buildings (see the figure on the right).Surfaces represented by a Digital Surface Model include buildings and other objects. Digital Terrain Models represent the bare ground.
DEM is often used as a generic term for DSMs and DTMs, only representing height information without any further definition about the surface.Other definitions equalise the terms DEM and DTM, or define the DEM as a subset of the DTM, which also represents other morphological elements.There are also definitions which equalise the terms DEM and DSM. On the Web definitions can be found which define DEM as a regularly spaced GRID and a DTM as a three-dimensional model (TIN). Most of the data providers (USGS, ERSDAC, CGIAR, Spot Image) use the term DEM as a generic term for DSMs and DTMs. All datasets which are captured with satellites, airplanes or other flying platforms are originally DSMs (like SRTM or the ASTER GDEM). It is possible to compute a DTM from high resolution DSM datasets with complex algorithms (Li et al., 2005). In the following the term DEM is used as a generic term for DSMs and DTMs.
Mappers may prepare digital elevation models in a number of ways, but they frequently use remote sensing rather than direct survey data. One powerful technique for generating digital elevation models is interferometric synthetic aperture radar where two passes of a radar satellite (such as RADARSAT-1 or TerraSAR-X or Cosmo SkyMed), or a single pass if the satellite is equipped with two antennas (like the SRTM instrumentation), collect sufficient data to generate a digital elevation map tens of kilometers on a side with a resolution of around ten meters[citation needed]. Other kinds of stereoscopic pairs can be employed using the digital image correlation method, where two optical images are acquired with different angles taken from the same pass of an airplane or an Earth Observation Satellite (such as the HRS instrument of SPOT5 or the VNIR band of ASTER).
The quality of a DEM is a measure of how accurate elevation is at each pixel (absolute accuracy) and how accurately is the morphology presented (relative accuracy). Several factors play an important role for quality of DEM-derived products:
• terrain roughness;
• sampling density (elevation data collection method);
• grid resolution or pixel size;
• interpolation algorithm;
• vertical resolution;
• terrain analysis algorithm;
• Reference 3D products include quality masks that give information on the coastline, lake, snow, clouds, correlation etc.
Methods for obtaining elevation data used to create DEMs Gatewing X100 unmanned aerial vehicle
• Lidar
• Stereo photogrammetry from aerial surveys
• Structure from motion / Multi-view stereo applied to aerial photography
• Block adjustment from optical satellite imagery
• Interferometry from radar data
• Real Time Kinematic GPS
• Topographic maps
• Theodolite or total station
• Doppler radar
• Focus variation
• Inertial surveys
• Surveying and mapping drones
• Range imaging
The Right Elevation Model for all Your Project Needs
Whether planning an infrastructure network, conducting a military intervention mission in unknown terrains, or analysing terrain features for oil and gas exploration: accurate terrain height information is critical.
Precise and reliable elevation data supports a wide range of applications and forms the foundation of any accurate geospatial product.
The GEO Elevation product suite - based on spaceborne optical and radar technologies - offers the most comprehensive elevation data range available on the market.
What You Get
• Elevation data matched to individual business need: large area coverage for large scale projects vs. high level of accuracy for local coverage
• Rapid on-demand delivery of high precision elevation data anywhere in the world
• All products framed to individual Area of Interest with
optimised pricing per km²
• Based on spaceborne optical and radar technologies
The scope of delivery can be adapted to individual needs by choosing to add a set of auxiliary layers or corresponding orthorectified images to the input data. Highly developed digital data processing flow line and a large production capacity allow for unique time and cost-efficient production and delivery.
for more technical information please visit : GEO Elevation Services
If you need more information, please download the brochure here
for sales and marketing information please contact : [email protected]
The New Standard of Global Elevation Models
A complete pole-to-pole coverage is one of the distinguished features of our WorldDEM. Coupled with an unrivalled accuracy and quality, these are the defining characteristics of this unprecedented dataset. The WorldDEM accuracy surpasses that of any global satellite-based elevation model available today and defines a new industry standard. WorldDEM provides a reliable and precise reference layer to enhance a wide range of applications.
WorldDEM in Brief
• Pole-to-pole coverage: Homogenous standardised DEM for any spot on Earth
• Unique quality: Superior elevation information anywhere on Earth
• Unrivalled accuracy: 2m (relative) / 4m (absolute) vertical accuracy in a 12m x 12m raster
• Digital Surface Models and Terrain Models available
• Easy access
for more technical information please visit : WorldDEM™
If you need more information, please download the brochure here
If you need WorldDEM™ Sample Data, please download
Digital Terrain Model or
Digital Surface Model
for sales and marketing information please contact : [email protected]
Documents
• Pleiades Satellite Imagery• Spot 6-7 Satellite Imagery
• Spot 5 Satellite Imagery
• KazEOSat-1
• SPOTMaps
• TerraSAR-X Radar
• GEO Elevation Services
• WorldDEM
• Spexer_500_1000
For sales and marketing information please contact : [email protected]